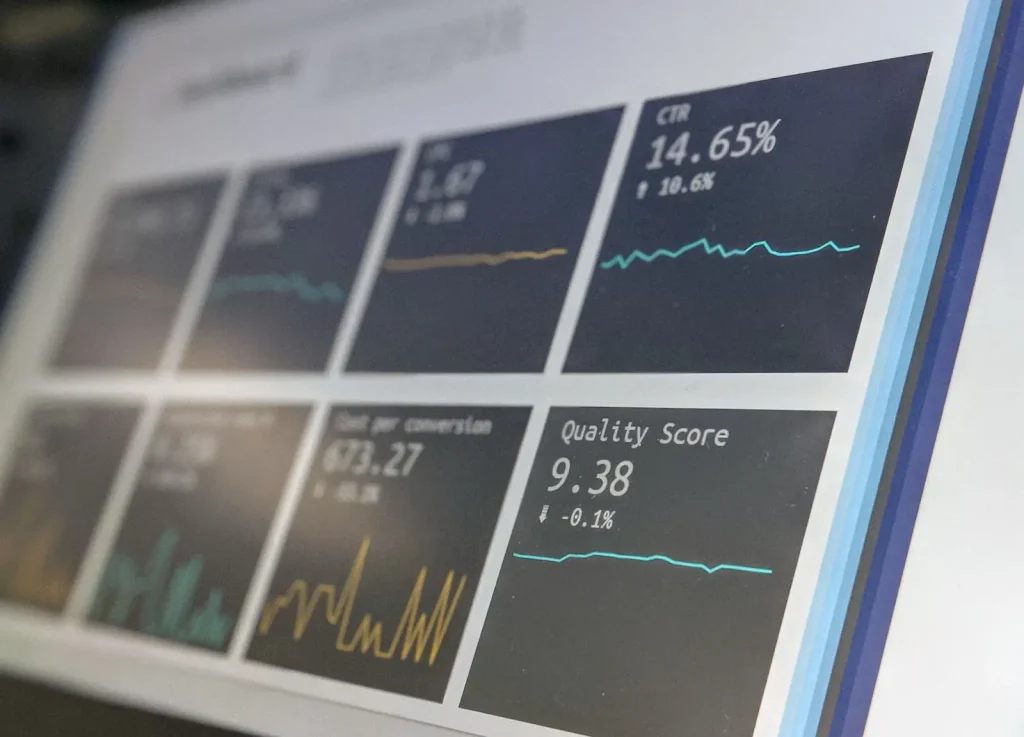
People ask us all the time: What can a dashboard do for me?
Want the short answer? In essence, dashboards give you the metaview of your processes, projects and performance metrics to streamline operations, empower team members, and find the shortest path to profitability.
Here are the top 5 ways that dashboards can drastically improve the way you do business:
Fuel Smart, Timely Decision Making
Dashboards organize and cull the results of data analysis and synthesis in a clear, colorful and accessible user interface, helping businesses easily understand and evaluate complex data. Informed and armed with current trends and performance indicators, business leaders are able to make smart decisions and strike when the iron is hot. All without bothering IT.
Not Just Data: Insights and Analysis Any Time You Want It
Of course, data in and of itself has no value until you combine, sort, compare, track, analyze and conclude. With a well-designed dashboard, you can leverage the value of your data at a fraction of the cost of hiring full-time analysts. Whether you’re managing your own data, or providing insights to your customers, everyone is upping their game.
See the Forest AND the Trees
With business dashboards, you can see real-time data analytics all at once, providing a single consolidated view of the variables and metrics that matter most. Get the big picture or drill down to see more detail. Benefit from the results of analysis of your data, knowing that it is up-to-date and reflecting real time conditions. Get a complete grasp of the performance landscape to make shrewd decisions based on real-time metrics and key performance indicators from multiple data sources, markets and departments.
Data is Objective
Thankfully, data doesn’t have feelings. It simply reflects performance results in a way that can serve as a foundation for further dialogue. If two or more departments have different opinions about phases of projects or certain processes, data can be surfaced to answer questions and evaluate best options.
Discover Problem Areas Before They Become Problem Areas
Once you can see trends and track performance on virtually any level, dashboards can help you discover where performance is weak and where problems are likely to occur. Forewarned is forearmed and decisions can be made to intervene with new strategies, product revisions or changes to personnel, as needed. And since any level of employee in the company can use dashboards – with access restrictions in place as desired – everyone is empowered to make better decisions and handle difficult problems at the source as they arise.