
Did you know that analysts spend over 50% of their time and more than 1,000 copy-paste actions each week updating KPIs, charts, and metrics? This manual, error-prone workflow becomes a bottleneck when scaling insights across teams.
A more efficient approach is to maintain a single, well-designed template and let the data populate itself. This is where ClicData’s Live Docs comes in. It enables PowerPoint, Excel, and Word files to update automatically at the moment of generation.
This article walks you through how Live Docs transforms static templates into automated, data-driven reports, reflecting insights from our recent webinar.
Why Do Reporting Workflows Slow Teams Down?
Reporting relies on static PowerPoint, Excel, and Word files that necessitate full manual maintenance with each cycle. This creates several technical bottlenecks:
- Manual Data Handling: Each reporting cycle requires exporting, copying, and reconfiguring metrics across files. Every manual touchpoint increases both time, cost and error risk.
- Fragile Formatting: Dynamic data breaks chart ranges, shifts layout alignment, and disrupts design elements. Maintaining brand and presentation consistency becomes a constant repair cycle.
- Disconnected Data Sources: Each update requires manual extraction of data in CRMs, analytics tools, spreadsheets, or databases without automated sync. This disconnected workflow cannot support real-time updates.
- Version Fragmentation: Once reports are shared, multiple copies start circulating with independent edits and outdated insights. Teams waste time reconciling discrepancies instead of acting on data.
- Limited Scalability: Delivering customized reports to clients or teams means duplicating effort across templates and datasets. Reporting stays linear while the number of outputs grows exponentially.
- Verification Overhead: After every update, teams must reverify formulas, chart ranges, and visual integrity to ensure the accuracy of published results.
Static files can’t keep pace with changing data. Live Docs solves this by generating fully branded documents directly from live sources, automatically, at scale, with zero manual updates.
Live Docs vs. Reports vs. Dashboards
Before choosing the right tool for your data story, it’s helpful to understand how Live Docs compare to Reports and Dashboards. Each serves a distinct purpose in the reporting ecosystem.
| Capability | Live Docs | Reports | Dashboards |
|---|---|---|---|
| Core Purpose | Produce branded Office documents with live data for presentations or client-facing deliverables | Generate structured, paginated documents for distribution or printing | Provide interactive, real-time analytics for internal analysis |
| Output Type | Editable PPTX / XLSX / DOCX | Paginated, print-ready pages | Live, web-based views |
| Interactivity | None — static | None — static | High — filters, drilldowns, interactions |
| Design Workflow | Designed fully in Office tools using placeholders | Built in a template-based report editor | Created with visualization widgets and layout tools |
| Branding Control | Very high — exact match to your template | Moderate — constrained by report layout rules | Moderate — functional layouts, limited visual styling |
| Data Behavior | Data injected at generation time; ideal for consistent snapshots | Data retrieved on execution; good for scheduled or batch output | Data refreshes continuously or on schedule; ideal for live monitoring |
| Best For | Client decks, board presentations, QBRs, sales reviews | Statements, compliance forms, multi-page summaries | KPI tracking, operational dashboards, exploratory analysis |
How Live Docs Work: Automated Document Setup in 5 Steps
Live Docs follow a streamlined setup that turns static Office files into dynamic, data-driven documents with minimal manual effort. Here’s how it works in five simple steps:
- Create a template document
- Upload the template to ClicData
- Configure placeholders as macros
- Preview and validate the live doc
- Automate and distribute via links or schedule
Now, let’s walk through a hands-on example to see exactly how to build and deploy a Live Doc.
Create a Template Document
Open your Office application (PowerPoint, Word, or Excel) and create the document you want to automate. In this walkthrough, we’ll use PowerPoint to demonstrate how Live Doc works.
Add all the slides you need with your usual layout, titles, text blocks, tables, and charts. Think of this as your final presentation design, just without the live data yet.
Now, decide where you want to display dynamic content. In those places, type placeholders directly into the slide content. A placeholder is simply any word surrounded by double square brackets. For example:
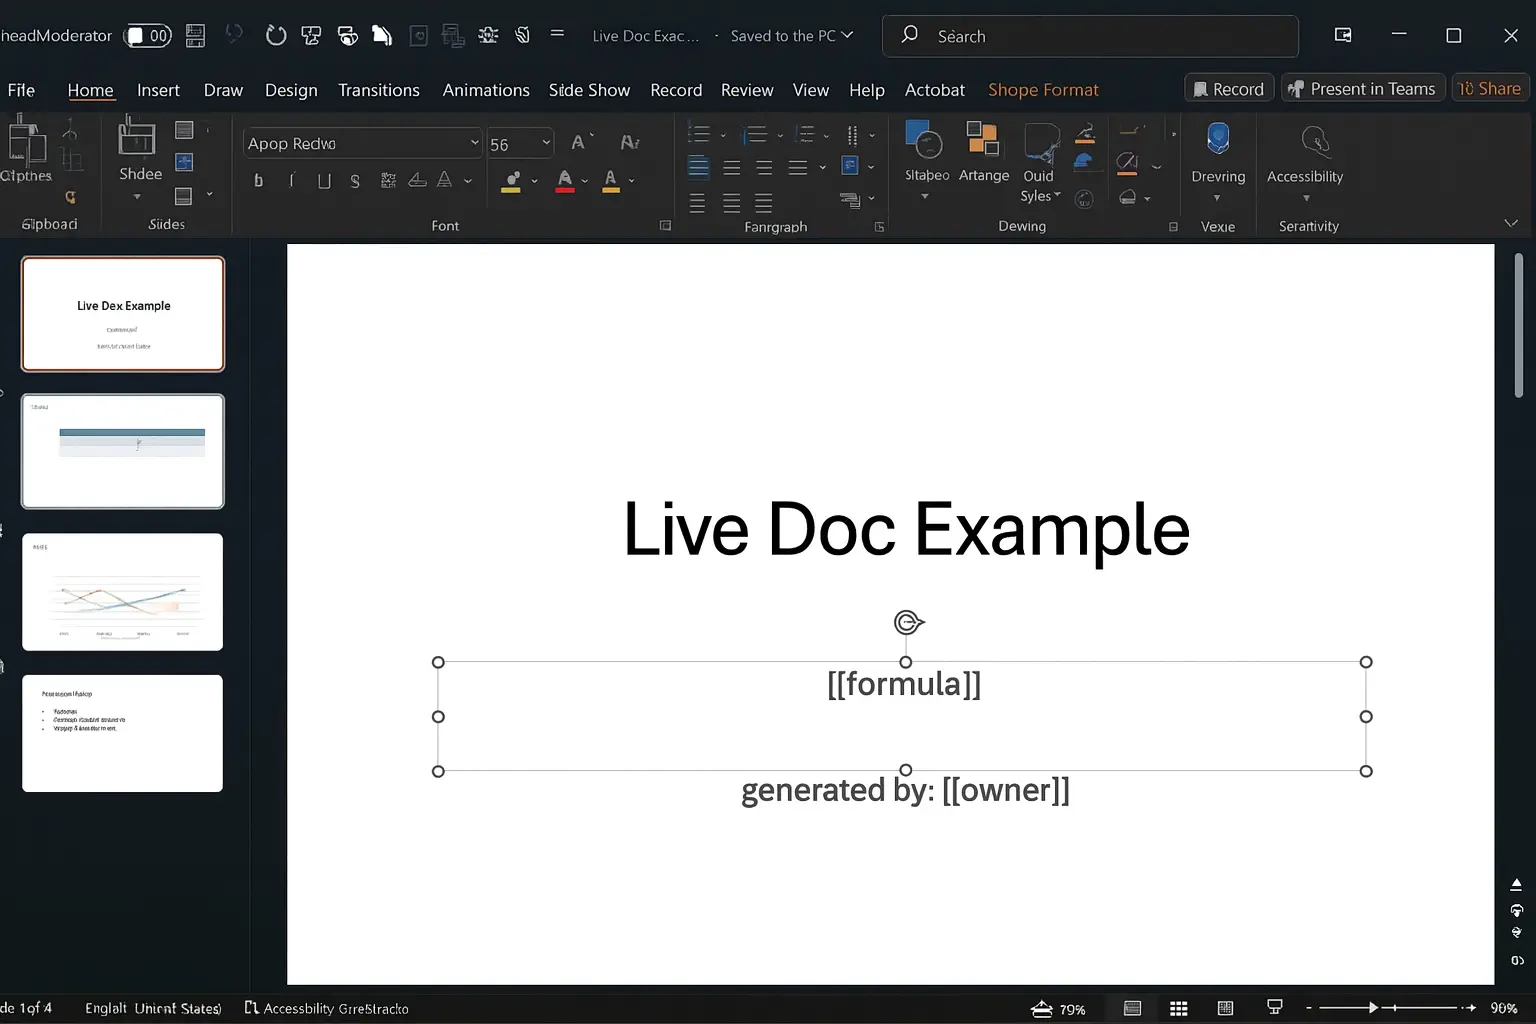
Figure 1: Preparing a PowerPoint Template
The syntax is intentionally simple. It is just text, and you can choose any word as long as it is wrapped in [[ ]].
Upload the Template to File Storage
Once your PowerPoint template is ready with placeholders in text, tables, and the chart’s data sheet, save it and switch to the ClicData platform.
Open the File Storage module where templates are managed. Upload your PowerPoint file there. Give it a clear name, such as “Live Webinar Template,” so you can recognize it later and save.
Now you should see your template listed in the storage area and ready to use for Live Docs.
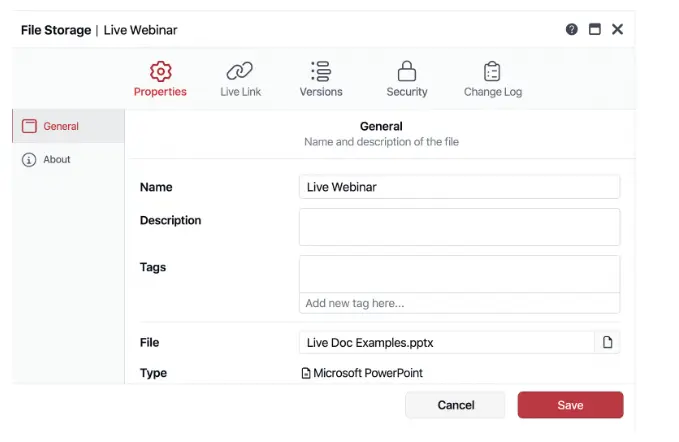
Figure 2: Uploading a File to the Storage Area of the LiveDocs
Create a New Live Doc from the Template
Go to the Live Docs section or menu and start a new document. Use the usual “Add New” or “Create” action.
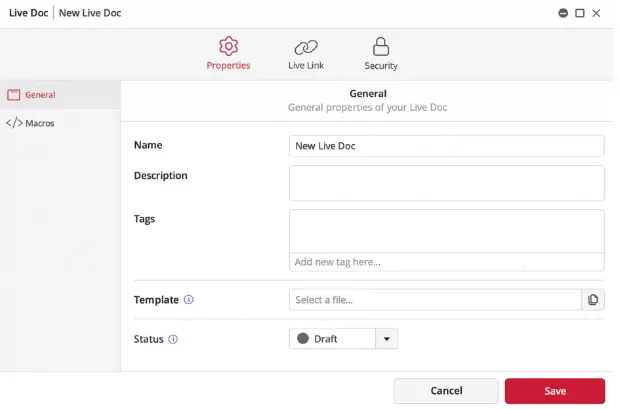
Figure 3: ClicData Interface Showing New Live Document Setup
When prompted to select a template, choose the PowerPoint file you just uploaded.
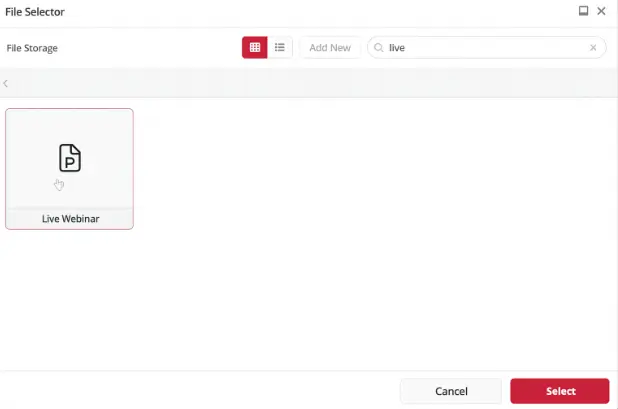
Figure 4. ClicData File Selector Interface
Configure Macros: Formulas, Tables, and User Parameters
Select one placeholder at a time and decide how to populate it.
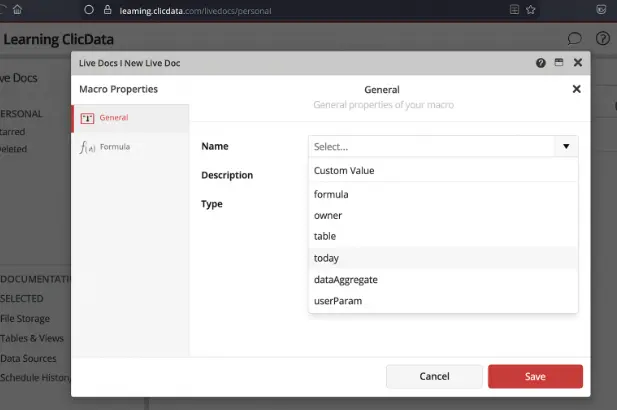
Figure 5. Live Docs Macro Type Selection
For a simple example, choose the [[owner]] placeholder. Set its type to a formula or table according to your data needs.
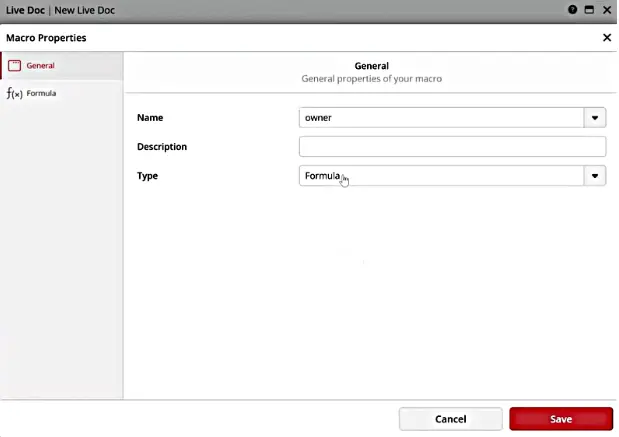
Figure 6. Macro Properties Panel
Once you select Formula as the macro type, click the Formula tab in the Macro Properties to configure it.
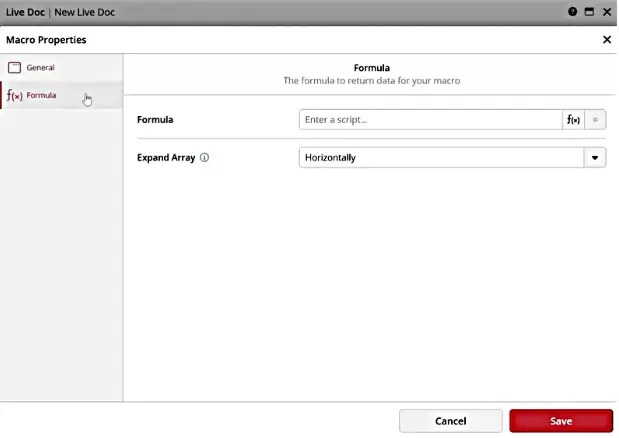
Figure 7. Formula Macro Configuration Screen
Click the formula to open the formula editor, then pick a Live Docs–specific formula that returns the document creator or owner.
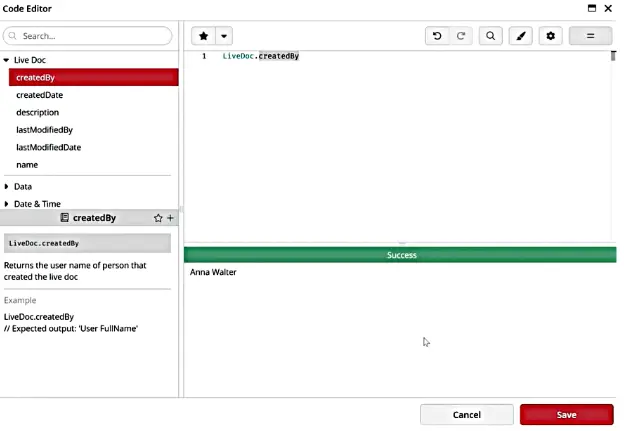
Figure 8. Code Editor Displaying Live Doc CreatedBy Result
Apply it and save. From now on, [[owner]] will be replaced with that user’s name when the document is generated.
For placeholders mapped to tables, choose “table” as the type. Then:
- Select which data table to use. The tables used in Live Docs are sourced from your connected datasets in ClicData, not from external files. You choose which dataset to map when configuring the placeholder.
- Pick the columns you want
- Choose whether you want a header
- Optionally set sorting
- Optionally limit the number of rows so the content fits your layout
- Add filters as needed based on the fields in your table
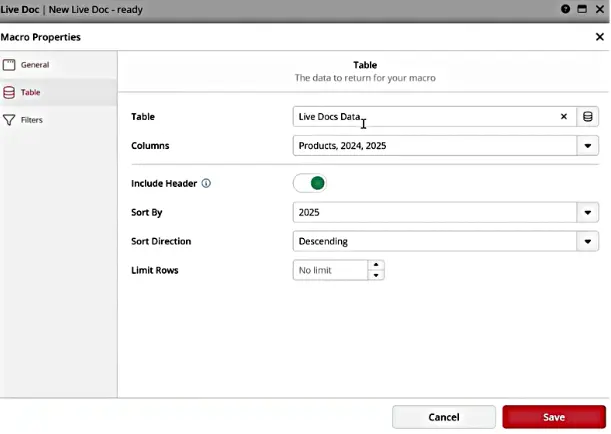
Figure 9. Table Configuration in Live Docs Macro
You specify how each placeholder should be populated, whether by a formula, table, or user parameter, during the macro configuration step in ClicData.
The system links each placeholder to its data source based on the type you assign. For example, use a parameter that holds a company name or client ID.
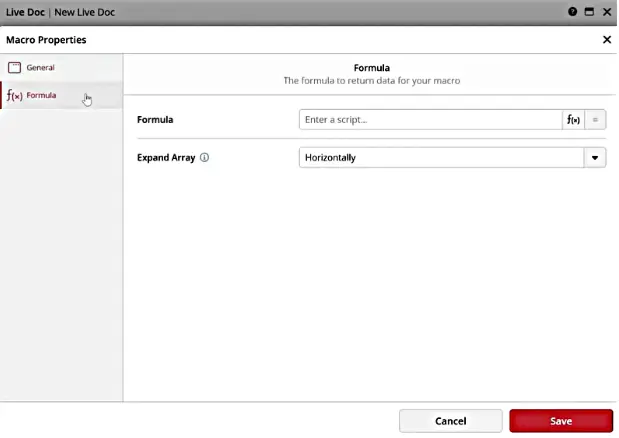
Figure 10. Formula-Based Macro Configuration Screen
When the Live Doc runs for different users, each generated document gets the value corresponding to that user, so text, tables, and charts are filtered or labeled appropriately.
Preview the Generated Document
Once some or all macros are configured, use the built-in viewer to generate a preview of the Live Doc. The PowerPoint is rendered with live data.
The owner placeholder now shows the actual user’s name.
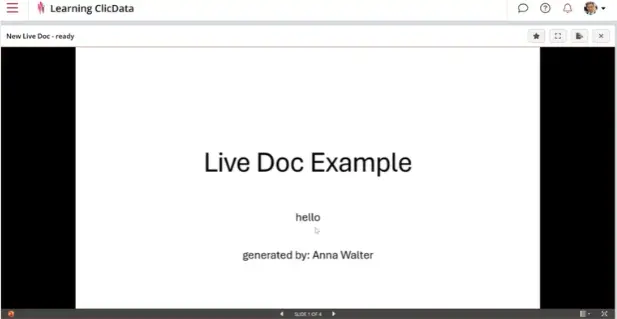
Figure 11. Live Doc Example Output Screen
The table placeholder is replaced by the selected dataset, sorted and trimmed according to your settings.
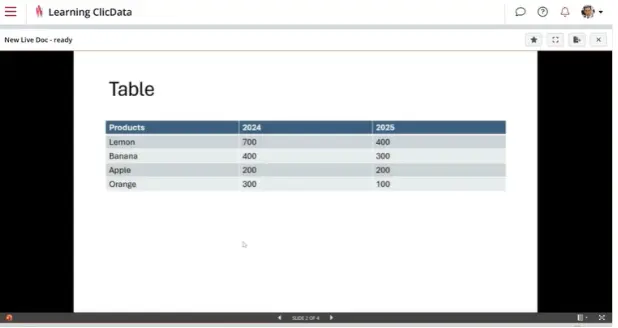
Figure 12. Live Doc Displaying Data Table
Share or Schedule the Live Doc
When the document looks correct, you can distribute it. One option is to enable a live link. This provides an instant preview link that you can share, along with optional security features. The recipient sees the generated PowerPoint in a viewer but does not automatically download the file.
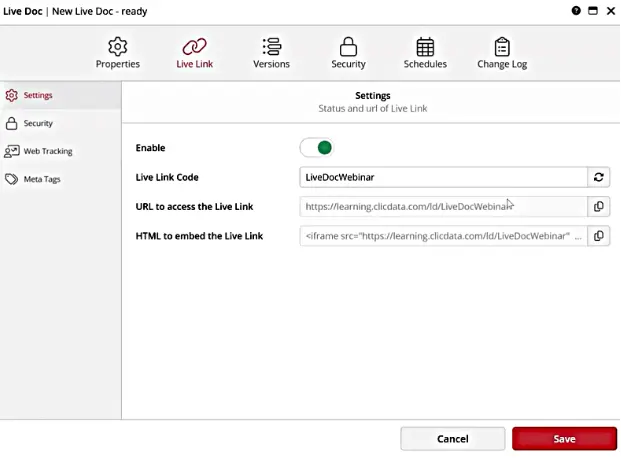
Figure 13. Live Link Settings Panel
Create a schedule to send the actual PowerPoint file as a document. Set it to run, for example, every Monday at a specific time. Choose the Live Doc as the target for the schedule, and pick your recipients. If needed, adjust macros or variables so they are evaluated at generation time.
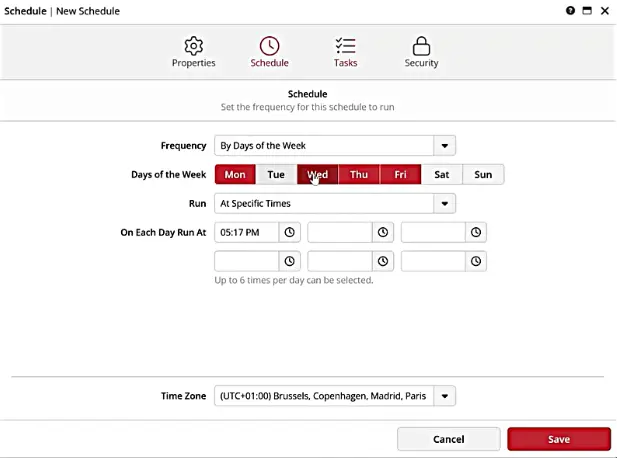
Figure 14. Live Docs Automated Schedule Setup Screen
If user parameters are in play, each recipient automatically receives a version of the Live Doc filtered and filled with their own values.
What are the Best Use Cases for Live Docs?
Live Docs are best suited for workflows that require recurring, data-driven documents to stay up to date without manual editing. Common examples include:
- Executive and Team Presentations: Weekly or monthly PowerPoint decks auto-filled with the latest KPIs and charts.
- Client-Specific Reports: Personalized Word or PowerPoint documents filtered by user parameters (e.g., region or account).
- Financial or Sales Summaries: Excel templates with formulas and tables populated with live and aggregated data.
- Branded PDFs for Distribution: Deliver polished, brand-aligned documents ideal for board meetings, newsletters, or client updates.
- Operational Snapshots: Automatically email scheduled reports, like daily or weekly performance summaries.
These use cases demonstrate how Live Docs enable scalable, professional reporting without manual effort.
Conclusion
Manual reporting can’t meet today’s speed and accuracy demands. ClicData Live Docs automates your Office templates with live data. It eliminates manual edits, reducing errors, and scaling report delivery with precision.
With support for formulas, tables, user parameters, and scheduling, teams can now deliver personalized, polished PowerPoints, Excel, and Word documents.
Ready to automate your reporting and reclaim valuable time? Explore ClicData Live Docs today and transform your reporting workflows.