Advanced Data Analytics Software for Smarter Insights
Use our Schema Analysis and Insights modules to understand your data, and our Data Scripts with Python and SQL to unleash its power.

Instant access to a scalable
Python & SQL environment
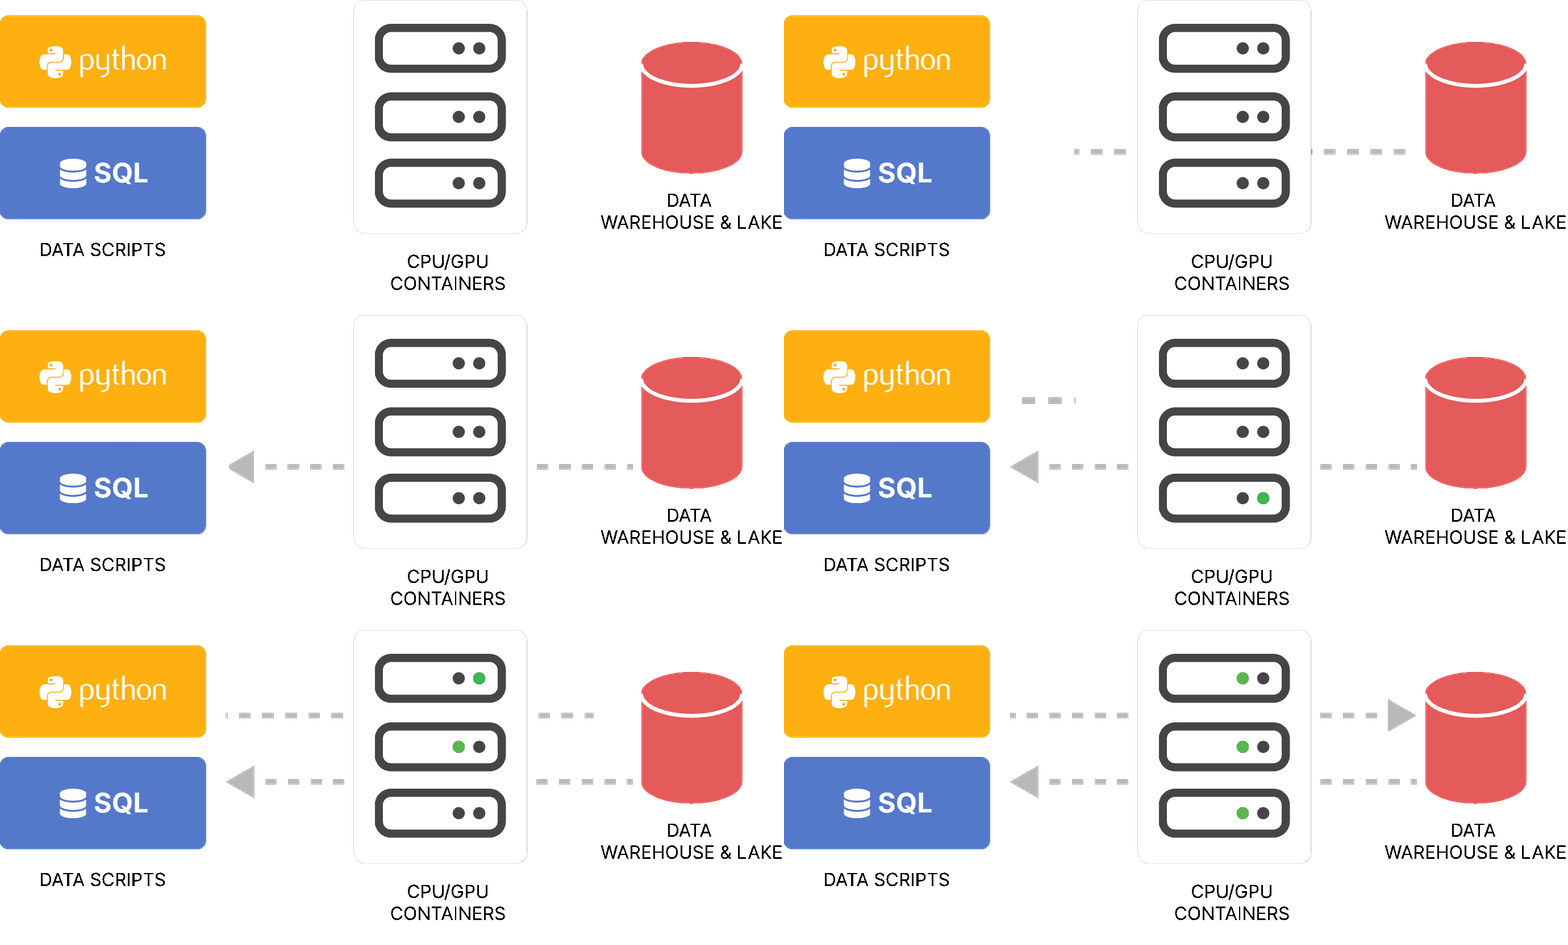
With ClicData’s Data Script module, you can launch a fully operational Python or SQL environment in just seconds, no setup required. Choose the performance you need, from 4 to 80 CPU cores, and even enable GPU acceleration for heavy workloads.
These environments run directly on top of your ClicData data lake and data warehouse, eliminating the need to move or replicate data between systems.
Everything happens in place, ensuring maximum speed and security.
These environments run directly on top of your ClicData data lake and data warehouse, eliminating the need to move or replicate data between systems.
Everything happens in place, ensuring maximum speed and security.
Powerful Analytics
Statistics, Segmentation, and Trends
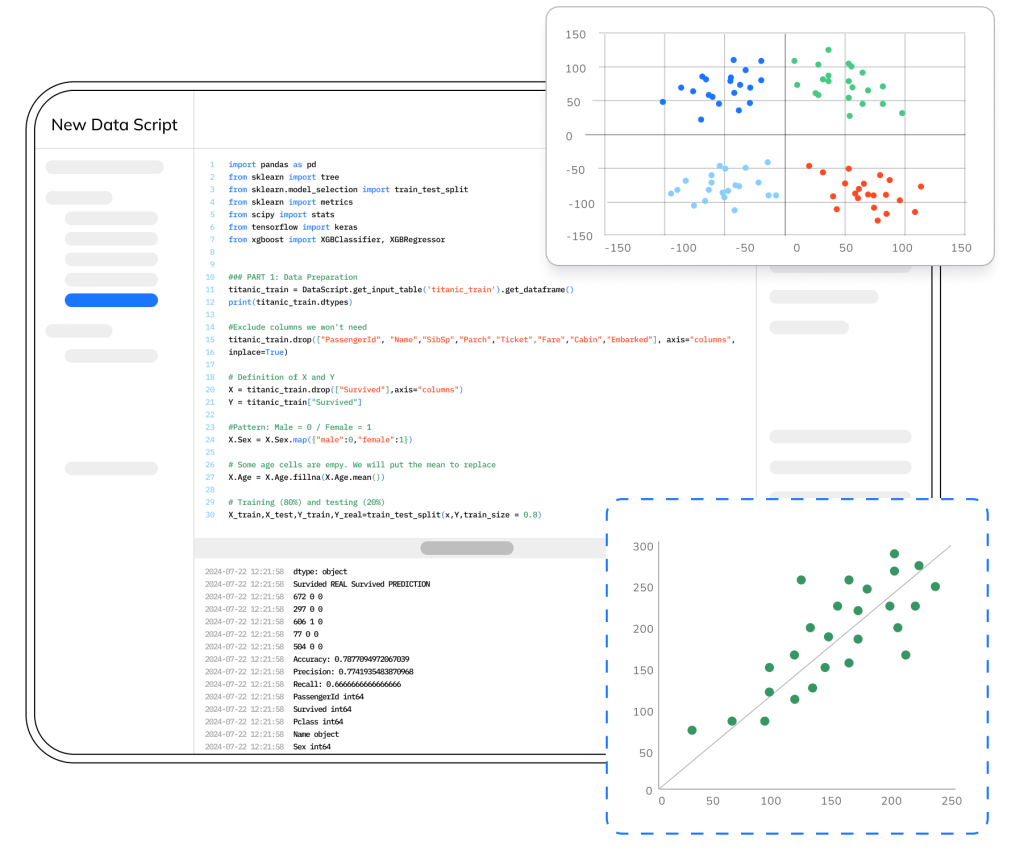
Whether you're working on customer segmentation, time series forecasting, regression analysis, or outlier detection, the Data Script module gives you the tools you need.
Run complex SQL queries, integrate your favorite Python libraries (like pandas, NumPy, and SciPy), and generate insights at scale. Build tailored analytics pipelines for departments, teams, or clients—all from within your ClicData platform.
Run complex SQL queries, integrate your favorite Python libraries (like pandas, NumPy, and SciPy), and generate insights at scale. Build tailored analytics pipelines for departments, teams, or clients—all from within your ClicData platform.
Built-In Machine Learning Capabilities
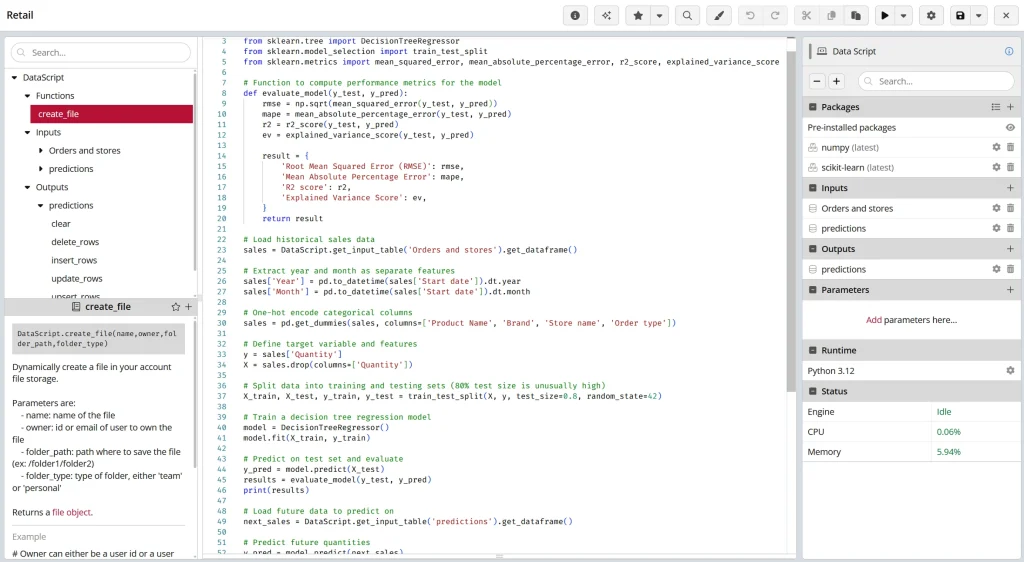
Use the Data Script module to train and deploy machine learning models using scikit-learn, TensorFlow, XGBoost, or any preferred library.
Predict churn, forecast sales, detect anomalies, or recommend products—all with data that's already integrated and prepped in ClicData. And because everything runs inside our managed compute layer, there’s no DevOps overhead or external orchestration needed.
Predict churn, forecast sales, detect anomalies, or recommend products—all with data that's already integrated and prepped in ClicData. And because everything runs inside our managed compute layer, there’s no DevOps overhead or external orchestration needed.
Insights
A no limit, high performance pivotting and filtering tool.
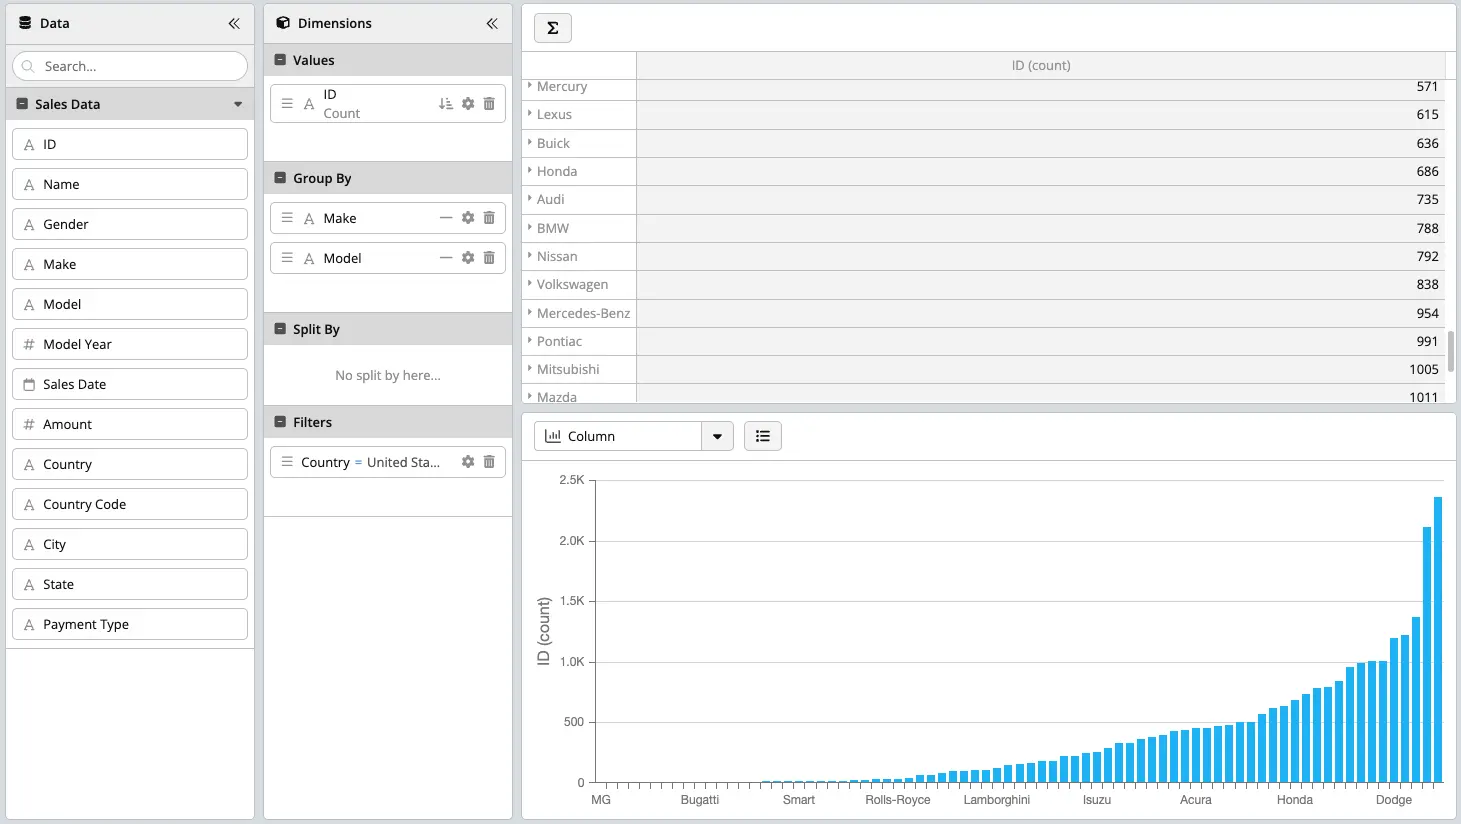
The Insights module gives you filters, grouping, pivoting, sorting, heat map and charting capability on any table so that you can start getting a sense of the data.
It is here to quickly get to the core of the data and start planning what you want to do with it downstream. You can also use it to start planning how to visualize it in your dashboards or save it for future comparisons with similar data.
It is here to quickly get to the core of the data and start planning what you want to do with it downstream. You can also use it to start planning how to visualize it in your dashboards or save it for future comparisons with similar data.
Schema Analysis
Start by understanding the data behind the data.
Understanding the meta data, the schema behind the data is critical to identify potential flaws, data gaps, analysis paths and much more.
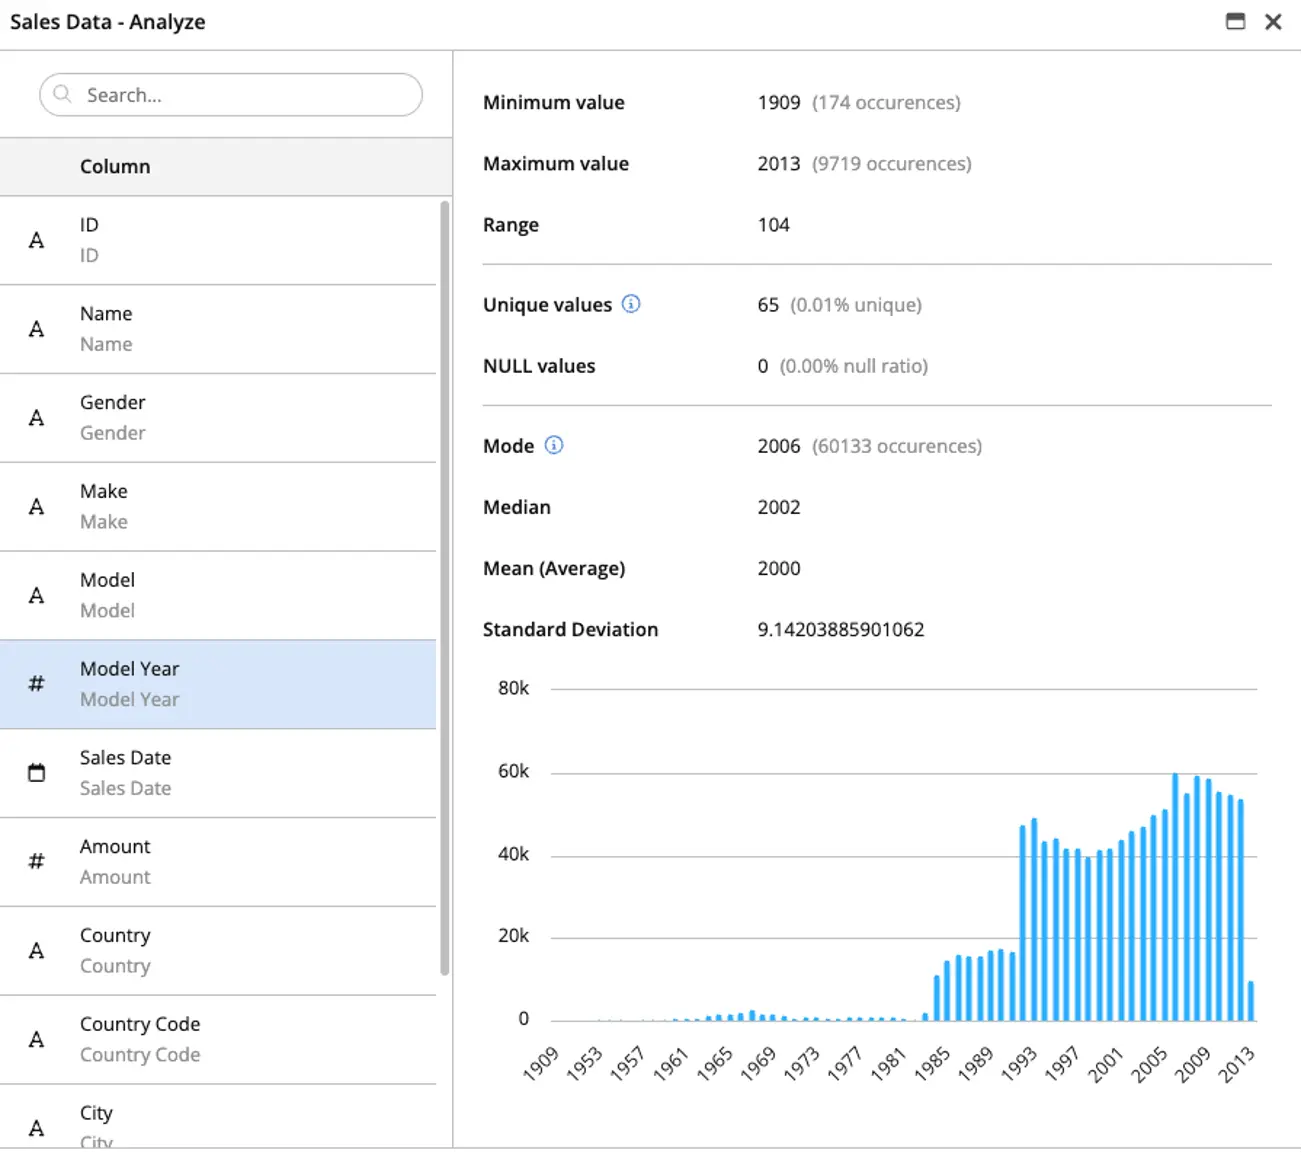
The Schema Analysis tool gives you the ability to quickly and accurately view the data distribution, null and empty data percentages, outliers and other critical information about your data.
The Schema Analysis tool gives you the ability to quickly and accurately view the data distribution, null and empty data percentages, outliers and other critical information about your data.