
AI-Powered Insights in Dashboards & Reports
Turn data into information by using our Dashboards to create interactive data documents and our Reports module for pixel perfect PDFs.
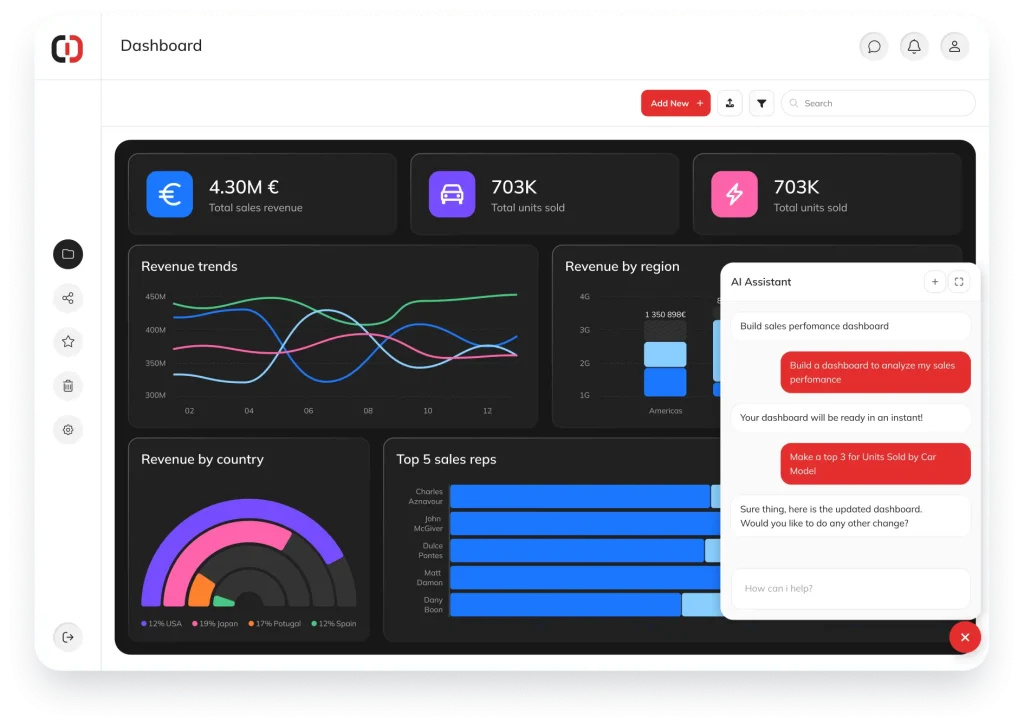
Dynamic Dashboards in Seconds with AI
Just describe what you want and our AI does the rest, choosing the right charts, arranging your data, and delivering instant insights. Whether you're tracking sales or monitoring operations, ClicData's AI turns your questions into beautiful dashboards instantly.
More than one way to turn data into information
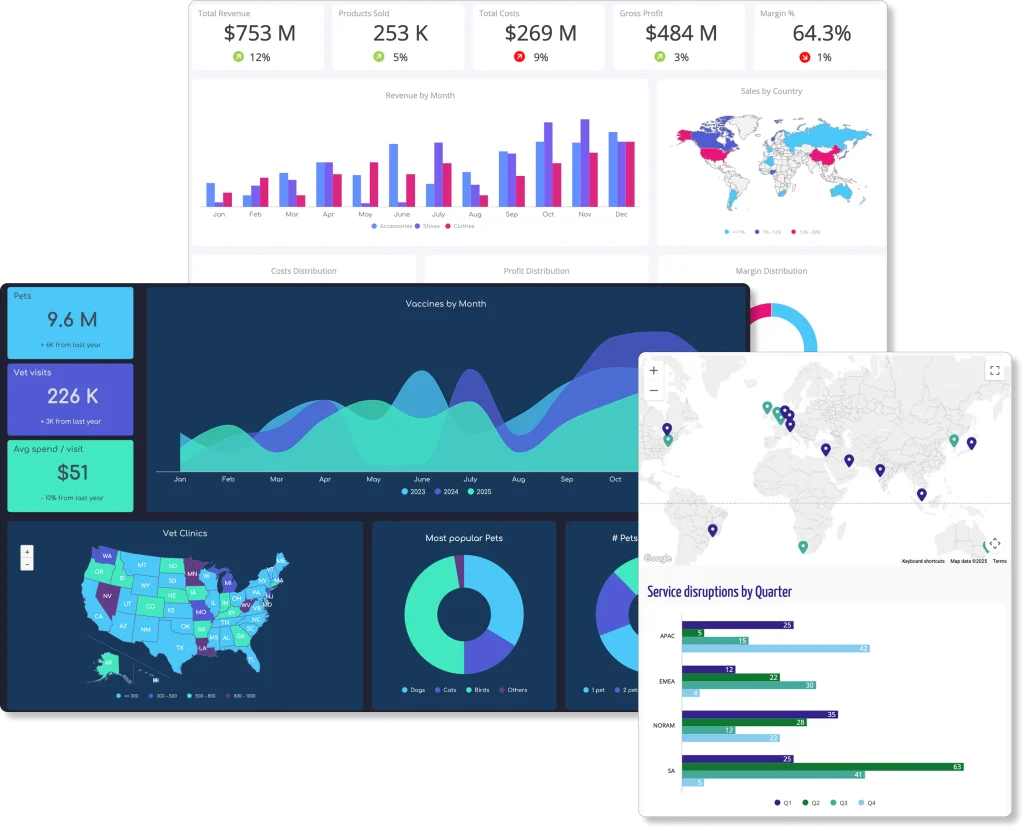
Dashboards
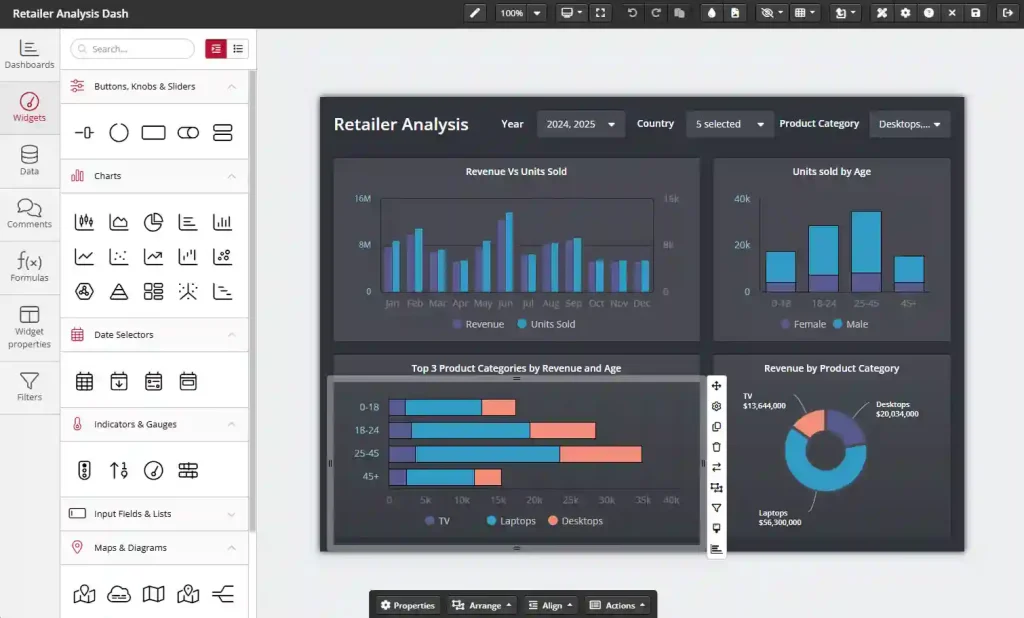
The dashboard that is so much more than a dashboard. It is a live data document that you can edit on any browser on your Mac, Windows or Linux machine.

Reports
Sometimes a PDF is the best way to receive data. Use the report designer to build stunning reports with cover pages, conditional formats, charts and sub-tables.

Power BI & Excel
If you prefer to use Power BI or Excel as your visualization and reporting tool, then simply use our plugins and get instant data each time you open your XLSX or PBIX files.
Your Dashboard. Your Design. Your Style.
Our dashboard editor does not impose styles, placement or constraints on your design and corporate identity. Create dashboards for the mobile, tablet, TV, and browser with 10 out of the box themes and any color palette you can imagine. Optionally, start from one of our ready to use templates. We have over 110 templates ranging for almost any industry.
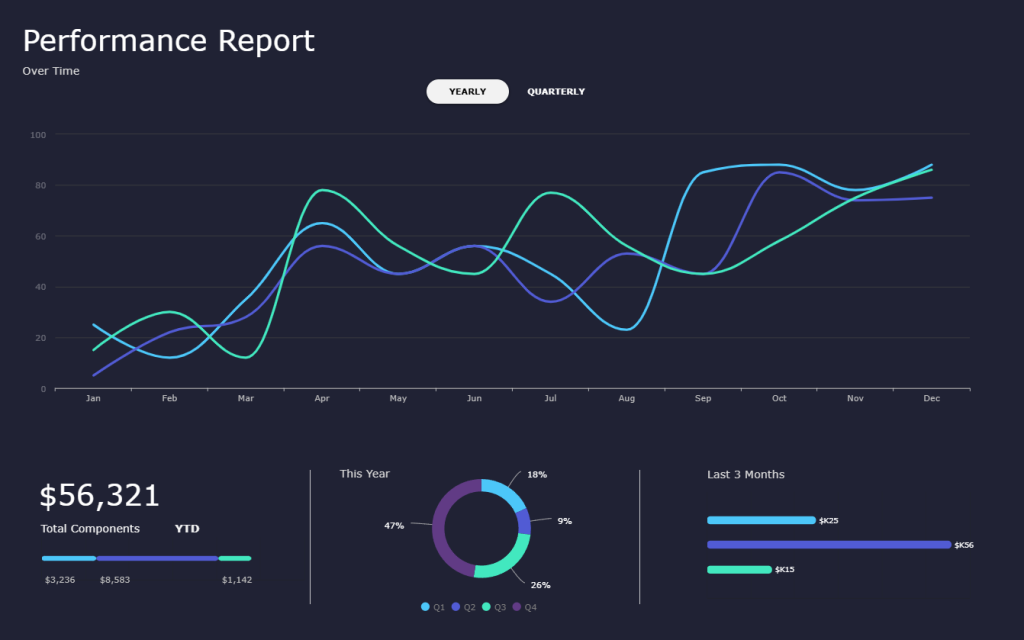
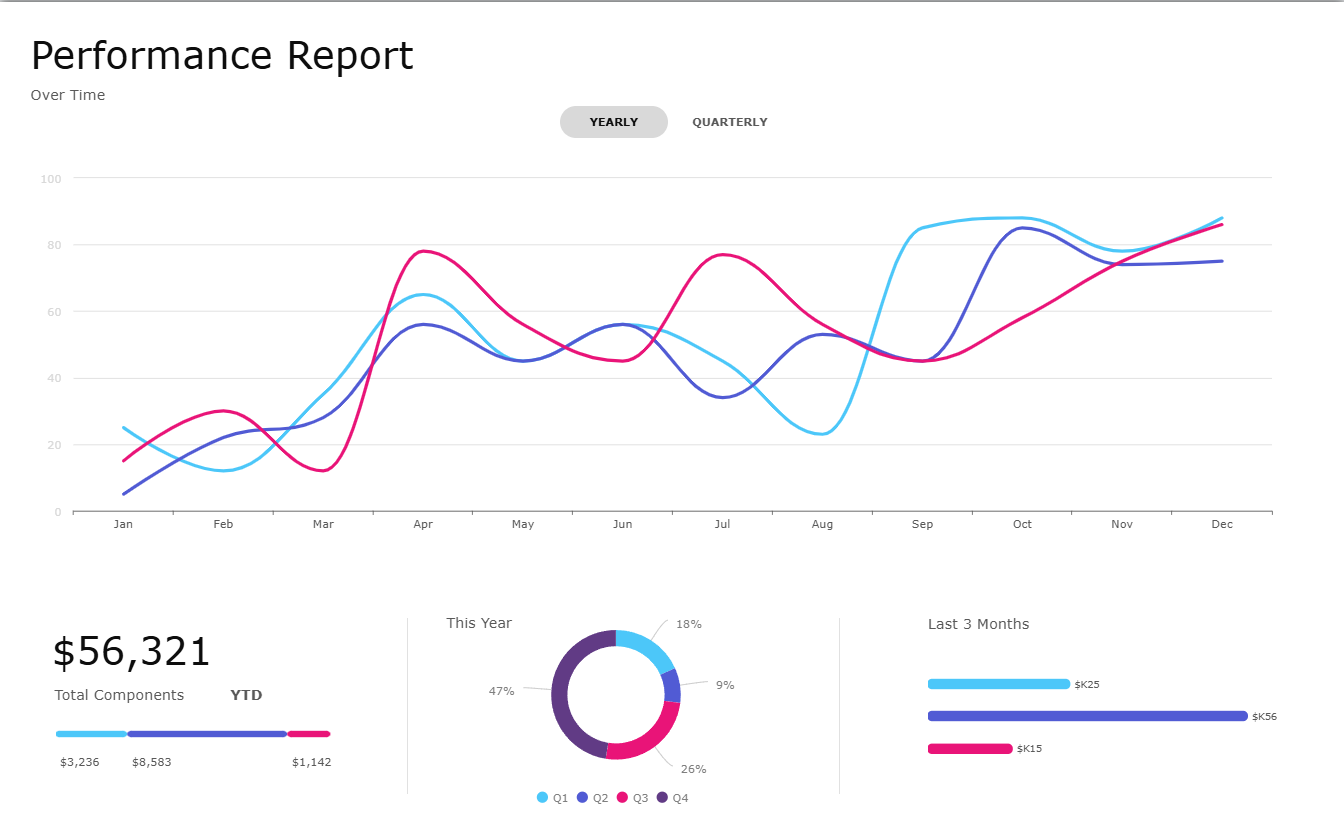
Over 80 drag-and-drop visualization widgets
No installation required. Just open up your favorite browser in your Mac or Windows machine and start dragging and dropping visualizations into your canvas. Start building in seconds...
The pixel perfect, multi-page, report builder
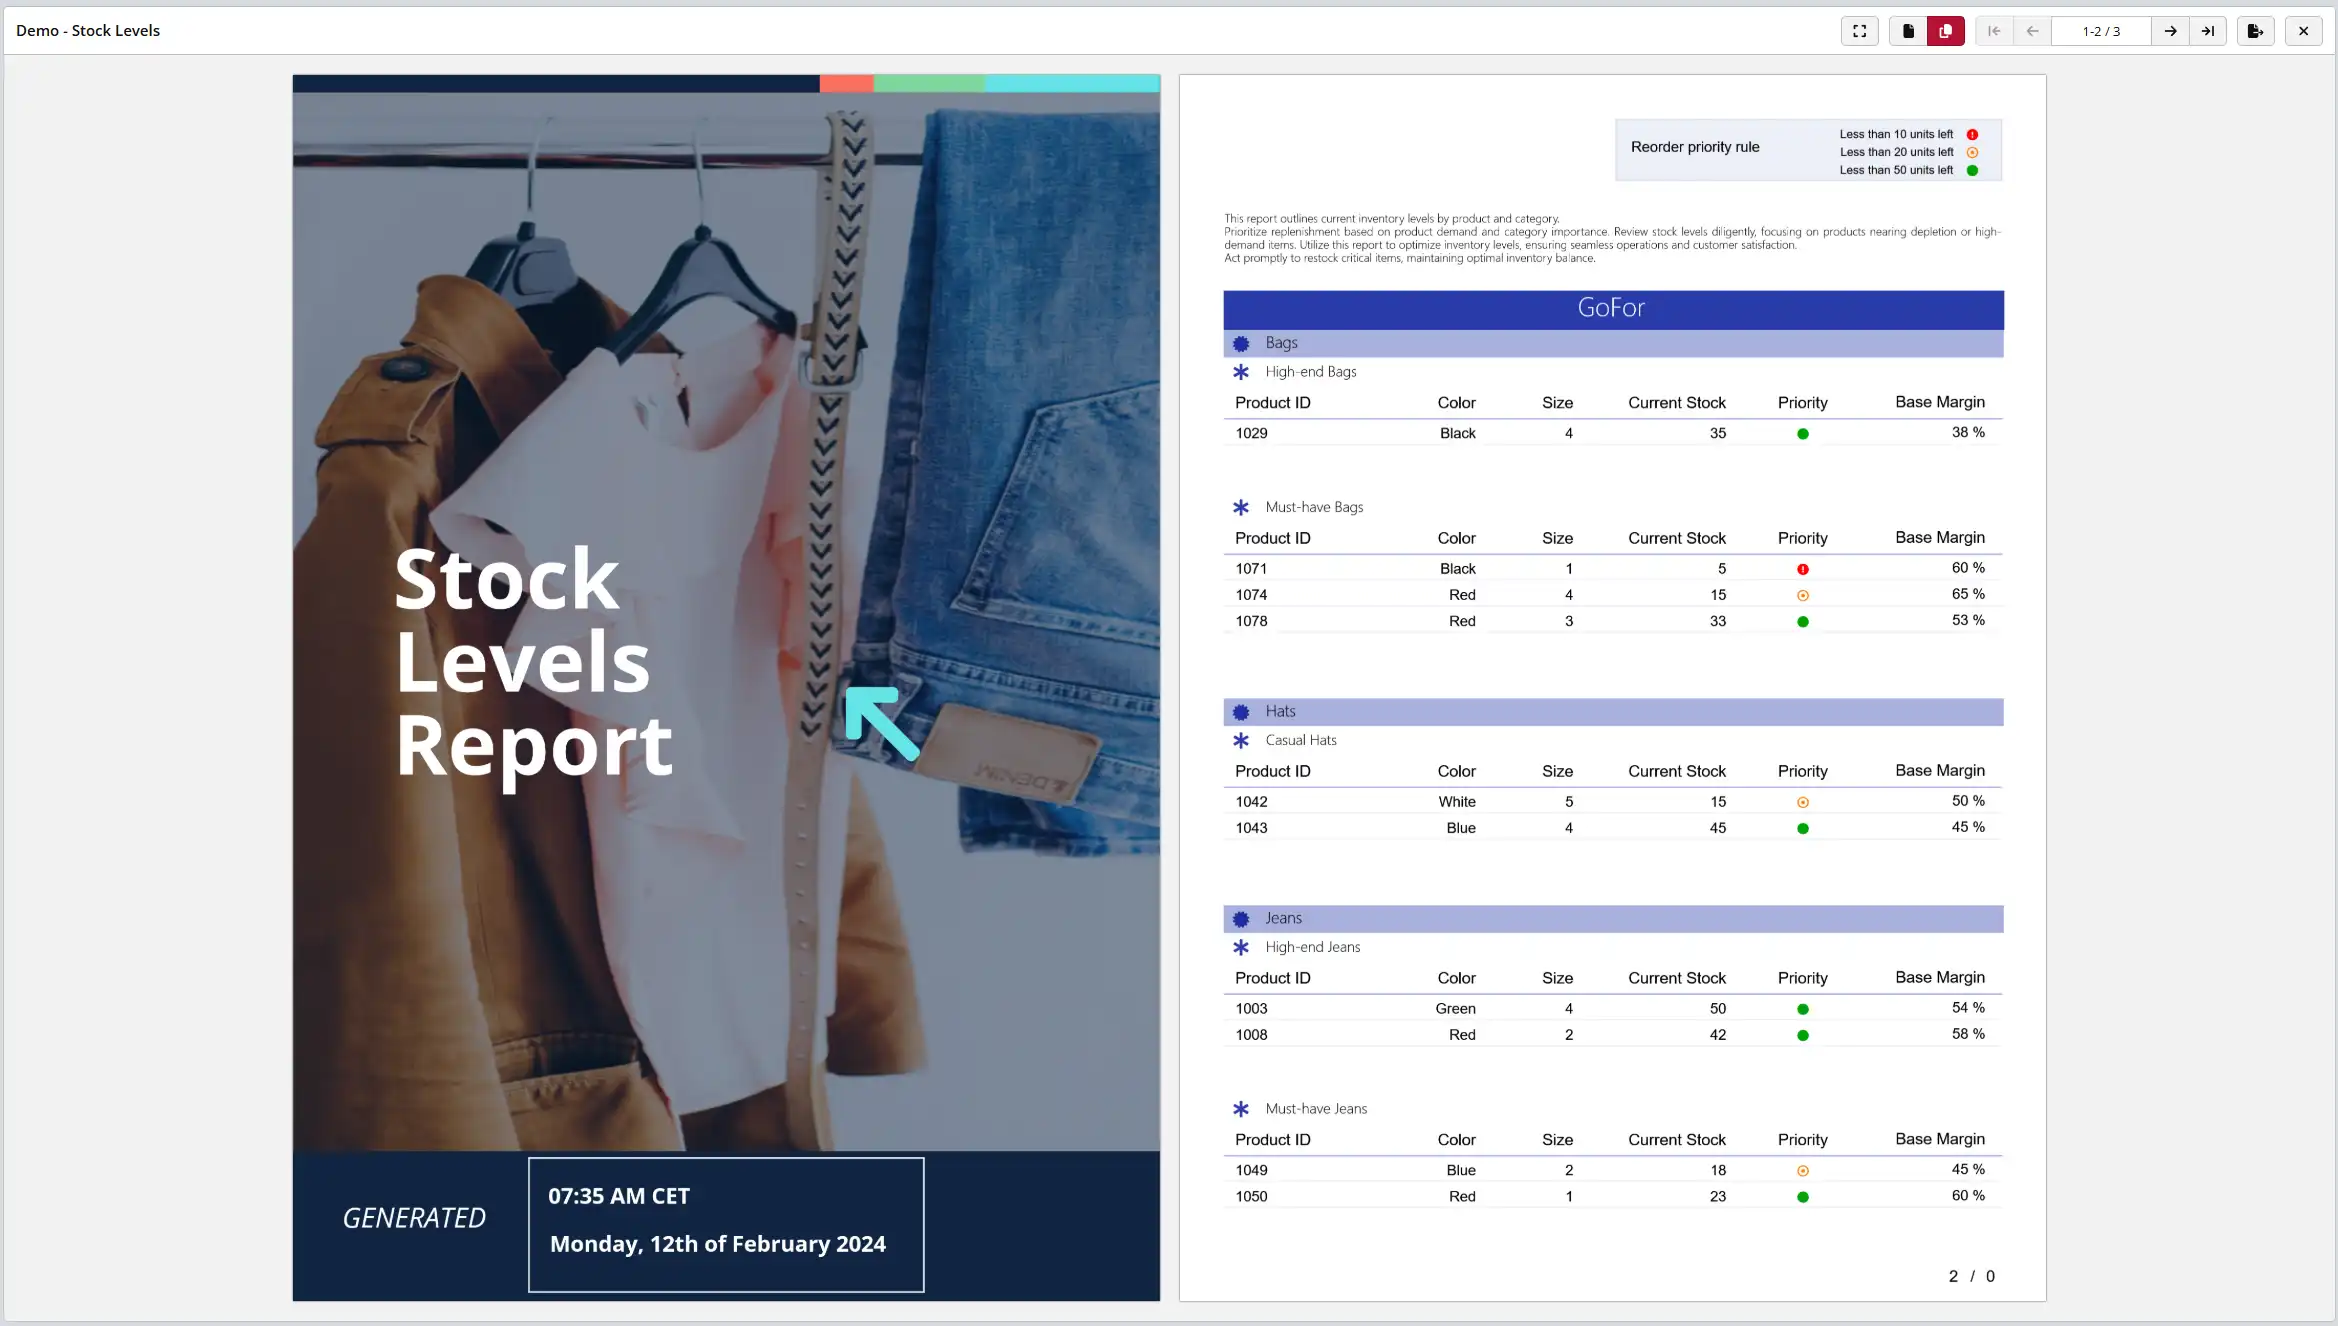

The report designer is a fully online designer capable of designing multi page reports that can be automatically or manually published in PDF. It can include data directly from the data sets, calculated columns, indicators, charts, sub-tables as well as markup features such as lines, rectangles and labels. Additionally it has the following features:
- Conditional formatting (color, font, visibility)
- Multiple data sets and sub-table linking
- Page break control
- Front and back cover designer
- Multiple section groups
- Runtime parameterization and filtering
- Designer alignment and snapping
- and more...

Power BI
Wait! Isn't Power BI a competitor?
Our mission at ClicData is to empower businesses and their data analysts to use their data the most efficient way possible. If you are comfortable with PowerBI (or any other tool for that matter), then use it.
Our job is to get you the data in a usable format and if Power Bi is the right tool for you to visualize the data then we built a great plugin for you to access the data inside your ClicData Data Warehouse directly from Power BI saving you the hassle of exporting it or moving it elsewhere.
Download the Power BI PluginOur mission at ClicData is to empower businesses and their data analysts to use their data the most efficient way possible. If you are comfortable with PowerBI (or any other tool for that matter), then use it.
Our job is to get you the data in a usable format and if Power Bi is the right tool for you to visualize the data then we built a great plugin for you to access the data inside your ClicData Data Warehouse directly from Power BI saving you the hassle of exporting it or moving it elsewhere.
We know you ❤️ Excel as much as we do
But we do get frustrated having to continuously create connections and paste data and make sure the formulas reference the new data, etc. etc. You know because you have been there before.
Well imagine building an amazing spreadsheet filled with awesome formulas, charts and dropdowns with data you exported from your systems. Then the next day you paste the data again and every formula breaks, errors appear everywhere or worse, wrong data is calculated.
Our plugin solves that by connecting your data tables in Excel directly to your ClicData Data Warehouse. Just open up the Excel spreadsheet, click Refresh and the entire data set in all your sheets will be refreshed.
Well imagine building an amazing spreadsheet filled with awesome formulas, charts and dropdowns with data you exported from your systems. Then the next day you paste the data again and every formula breaks, errors appear everywhere or worse, wrong data is calculated.
Our plugin solves that by connecting your data tables in Excel directly to your ClicData Data Warehouse. Just open up the Excel spreadsheet, click Refresh and the entire data set in all your sheets will be refreshed.
 Download Excel Plugin