Years ago, the birth of the digital marketing agency gave the illusion that FINALLY the value of marketing could be proved with the magic of data and technology. Unfortunately, the reality for many agencies is drowning in unconnected data from multiple marketing channels and client systems. Many hours are wasted manually building reports, only for a client to say they don’t understand it. Then comes the most damaging question: what are we even paying an agency for?
Fortunately, a reporting tool for digital marketing agencies can help agencies overcome this challenge. Data management platforms provide value and structure to the vast amount of data across disparate company systems, pulling in information from multiple sources and automatically consolidating it into report dashboards your team can actually use to guide the client to the best next step. And the best part? You build the dashboard once and reuse the same structure for every client you add.
Below are seven examples your agency can put to work this week.
Key Takeaways
- Different platforms need different dashboards. A generic “marketing dashboard” that tries to show everything ends up read by no one; the ones that get opened are built for one platform or one role.
- A rising CPA isn’t automatically bad news. Your ad channel dashboard should connect spend to downstream account value, not just channel-level cost, or you’ll end up killing campaigns that were actually working.
- Organic and paid social don’t belong on the same view. TikTok’s organic performance lives or dies on completion rate and shares; mixing that with paid social spend just muddies both signals, which is why it gets its own dashboard separate from the broader social media overview.
- The structure matters more than the client. Build a dashboard once, connect a new client’s data sources, and reuse it; that’s what actually saves an agency time at scale, not any single dashboard.
- White-labeling isn’t cosmetic. A client sees a branded dashboard as agency expertise. The same data from a generic tool export reads as “just a tool.”
7 Key Marketing Report Dashboards to Track
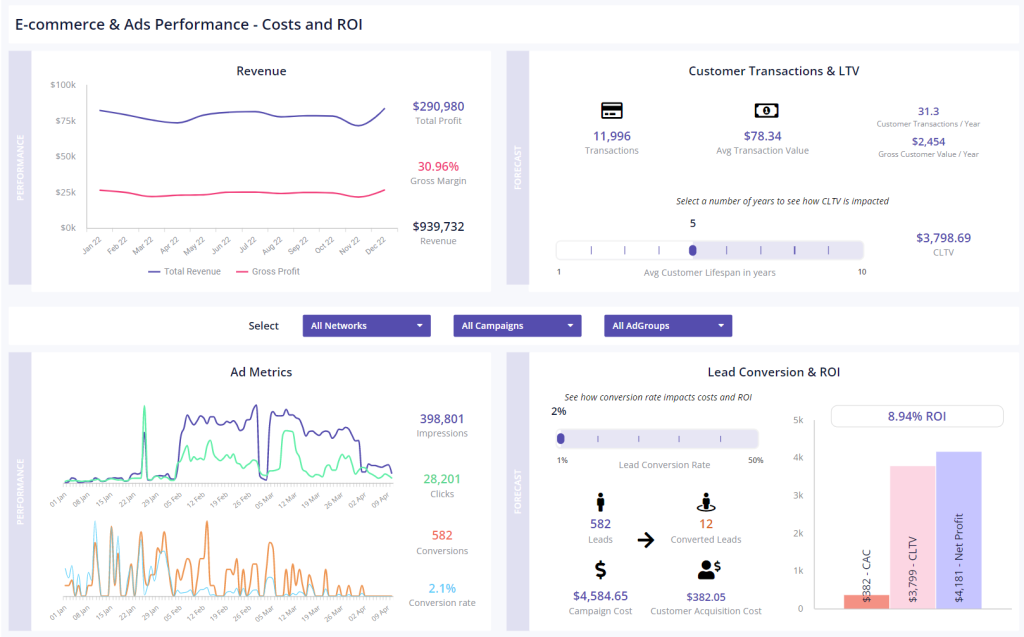
1. Ecommerce & Ad Channels Performance Dashboard
Your client sees CPA tick up on one ad channel and revenue dip 8% in one region the same week and wants an explanation for both, right now. This dashboard puts ecommerce revenue, customer behavior, and ad channel performance (spend, CPA, ROAS) side by side, so you can tell whether it’s a marketing problem, a seasonality problem, or an ad account problem before the client has to ask. A rising CPA on one campaign doesn’t automatically mean “cut it”; this view shows whether that campaign is still feeding profitable revenue downstream.
2. Google Analytics Report Dashboard
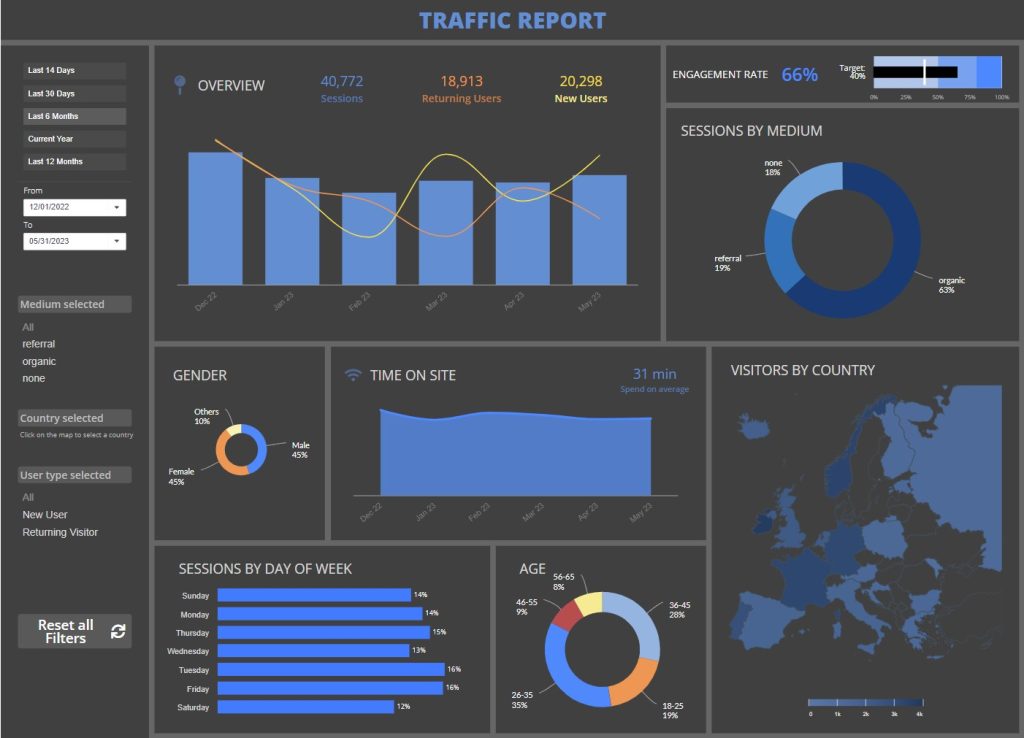
A staple in the digital marketing agency toolkit, but “staple” undersells it. This dashboard takes the classic GA4 metrics page views, bounce rate, exit rate, and best- and worst-performing pages — and connects them to the channels actually driving that traffic, so a spike in page views means something instead of just being a number that went up. See which landing pages convert and which just accumulate visits, then feed that straight into where the next campaign dollar goes.
3. TikTok Content Performance Dashboard
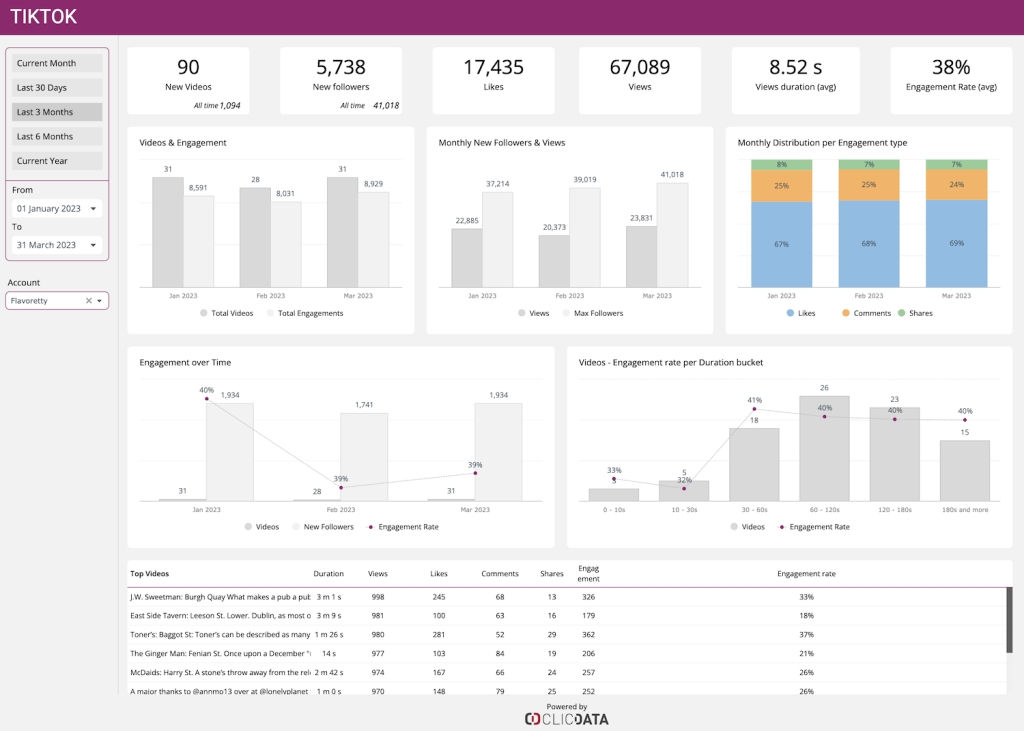
Organic TikTok content lives or dies on completion rate and shares, not follower count alone, and those signals move faster than almost any other platform. This dashboard tracks completion rate, shares, and follower growth specifically for organic content, so you can separate what the algorithm is actually rewarding from what just got lucky once.
4. Social Media Performance Overview Dashboard
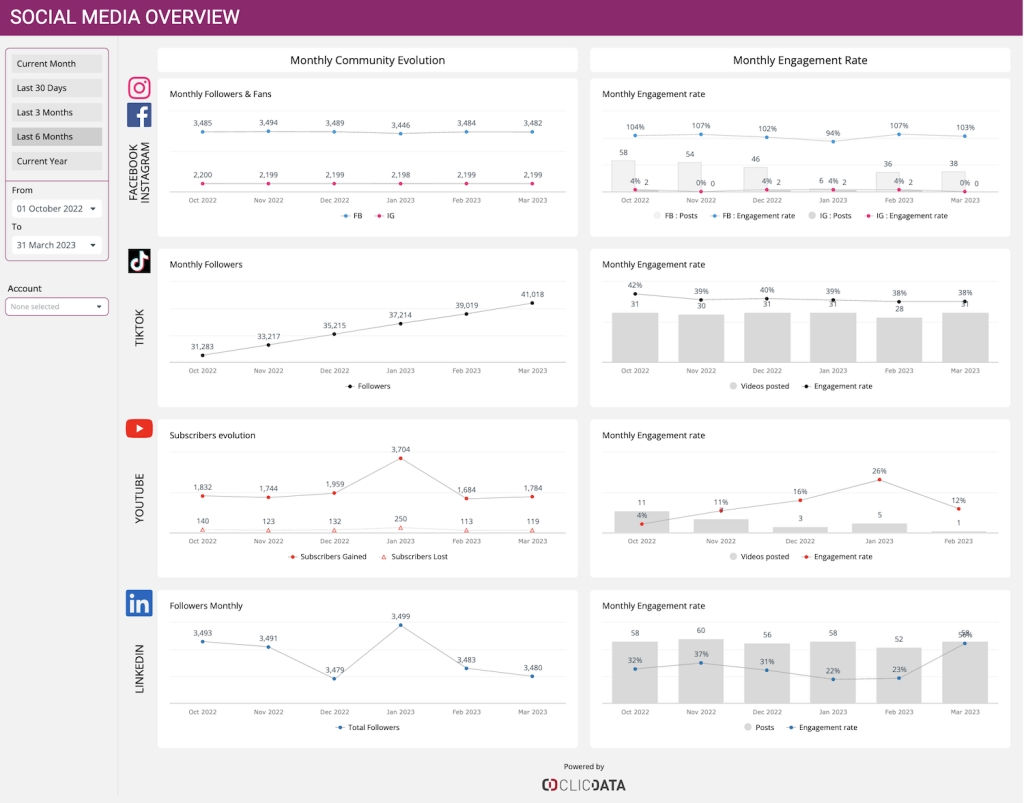
Reach and engagement across every platform in one place look impressive until a client asks which of it actually drove business. A social media dashboard shows reach, engagement, and follower growth alongside the referral traffic and conversions each platform actually generated, so you can show a client where their social budget is working, not just how many likes it collected. Avoiding vanity metrics matters most here, since likes and followers are the easiest numbers to mistake for progress.
5. Retail Customer Profiling Dashboard
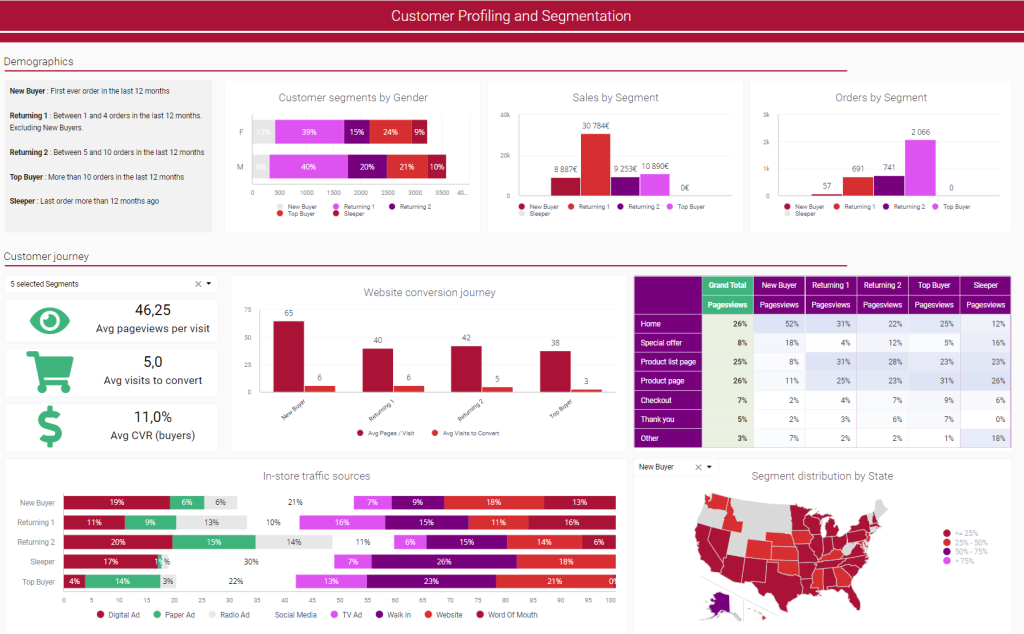
A campaign built for “everyone” converts for no one, and in retail, where margins depend on repeat purchases, that’s an expensive mistake. This dashboard pulls together your client’s CRM, ecommerce platform, and point-of-sale data into a single customer profile, so targeting is based on who’s actually buying, not a guess dressed up as a persona slide.
6. SaaS Customer Retention Dashboard
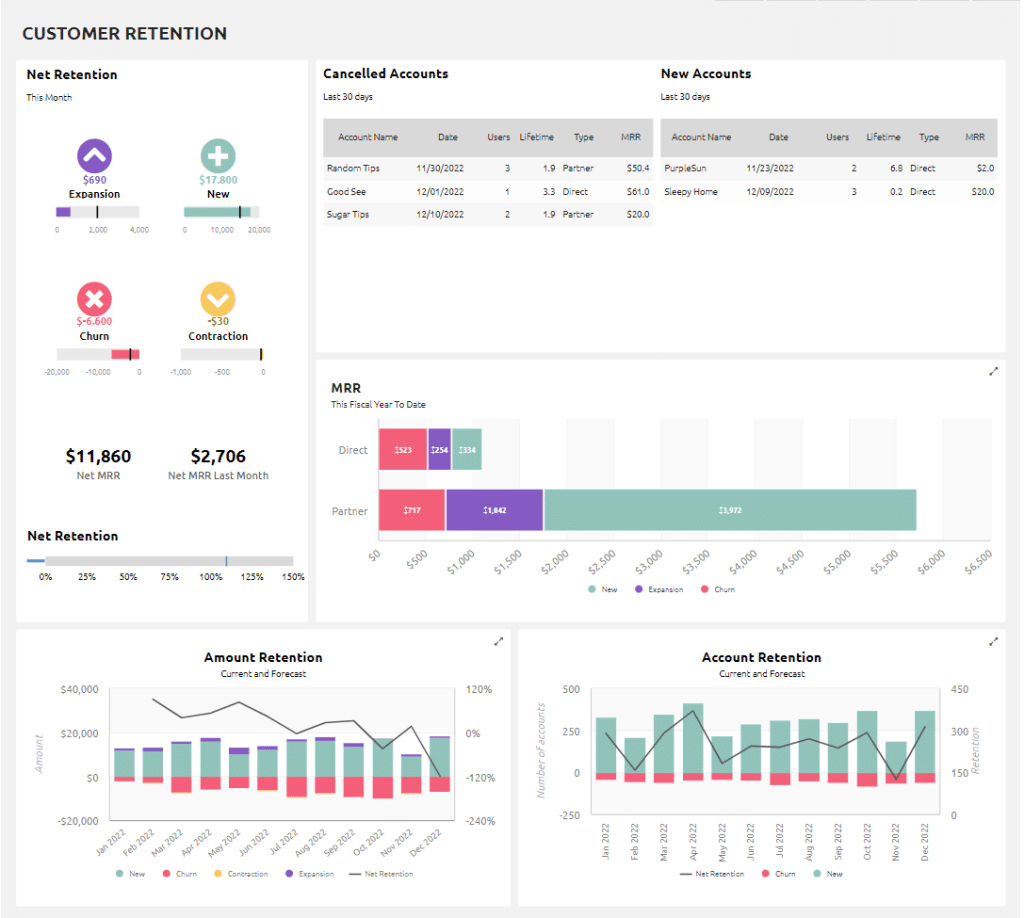
A SaaS client doesn’t just want to know how many new sign-ups came in this month; they want to know whether their existing customers are staying. This dashboard tracks churn rate, renewal rate, and expansion revenue side by side with acquisition numbers, so a strong new-signup month doesn’t hide a retention problem.
7. HubSpot Email Campaign Dashboard
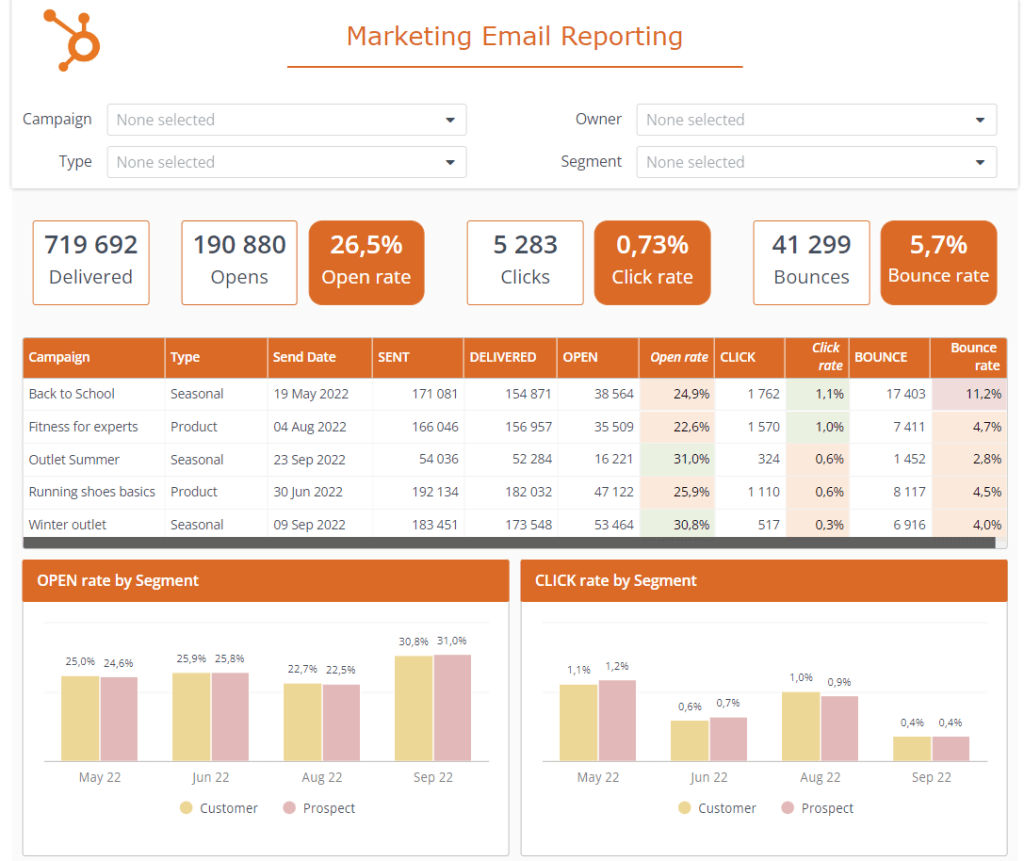
Open rate looks like progress until you check whether anyone actually clicked through and converted. This dashboard connects HubSpot email performance opens, clicks, unsubscribes to the downstream conversions those campaigns actually drove, so a client asking “how did the newsletter do” gets an answer tied to revenue, not just engagement.
Built for Agencies Managing Multiple Clients
Every one of these dashboards works the same way for your fifth client as it does for your first. Build the structure once, connect a new client’s data sources, and you have their version: same layout, same metrics, their branding instead of a generic export. Add dashboards to a binder to hand off one complete report package instead of a folder of screenshots pulled from five different platforms.
That’s really the difference this makes: not any single dashboard above, but not having to rebuild your reporting process every time you sign a new client.
Why Not Just Ask AI to Build the Report?
Ask a generic AI tool to “build me a report,” and it’ll happily generate something that looks like an answer. The problem is what’s underneath it: AI is only as good as the data you feed it, and most agencies feed it a mess. Ask an AI to calculate “conversions” when Google Ads, GA4, and the client’s CRM each define a conversion differently, and it’ll pick one silently and never tell you which. That’s not an AI problem; it’s a data foundation problem, and no amount of prompting fixes it.
A semantic layer solves this by defining what your metrics actually mean once, consistently, across every source, before any AI touches the data. Get that right, and AI stops guessing and starts answering correctly.
That’s exactly what ClicData’s upcoming MCP server does: it connects your governed, already-defined data to the AI tools your team already prompts every day, so an agency marketer can ask for an up-to-date client dashboard in plain language and get one back in minutes, built on real, connected data instead of whatever the AI could scrape together on its own.
What Agencies Are Saying
“We are a full-service marketing agency. We needed to provide our clients with a clear, reliable, and accessible view of all of their marketing data: website, social media, email, affiliate programs. ClicData is the ideal analytics tool for agencies, as it integrates seamlessly with all marketing systems, is fast to onboard, and is fully customizable with white labelling. We built all the KPIs we needed to demonstrate the impact of every marketing effort at each stage of the sales and marketing funnel. We even went further by creating detailed reports on engagement generated by LinkedIn content and email campaigns.”
— Fractional CMO, Full-Service Marketing Agency (US)
Start Reporting Smarter Today
These are just seven examples of the pre-built dashboards available in ClicData. You can also build your own, or work with our team to set them up, then package them into a branded binder and reuse the same structure across every client account. Start Your 15-Day Free Trial and connect your first client’s data today, or visit our marketing agencies resources hub for more.
FAQ
What is a marketing reporting dashboard?
A marketing reporting dashboard pulls data from your ad platforms, analytics tools, and client systems into one visual report, so you can see campaign performance without manually compiling screenshots or exports from each platform separately.
What should a digital marketing agency dashboard include?
At minimum: campaign performance by channel, traffic and conversion data from analytics, ad spend and CPA by platform, and a customer or audience view. Which of those matters most depends on the client and the campaign, which is why role- and platform-specific dashboards work better than one dashboard trying to show everyone everything.
Can one dashboard work for multiple clients?
Yes, if the underlying structure is built to be reused rather than rebuilt. A dashboard built once in ClicData can be connected to a new client’s data sources and reused with their branding, rather than starting from a blank page for each new account.
Do marketing agency dashboards need to be white-labeled?
Not always, but it matters when a client sees the report as part of what they’re paying the agency for. A dashboard on the agency’s own branding reads as agency expertise; the same data on a generic third-party export reads as just a tool.
How is an agency dashboard different from a standard analytics dashboard?
A standard analytics dashboard typically reports on a single platform for a single business. An agency dashboard needs to combine multiple platforms per client, maintain the same structure across many clients, and carry the agency’s own branding rather than the tool’s.